Picture an executive review: revenue, customer acquisition, conversion, retention and a dozen more measures fill an immaculate screen. Every number has a trend line, every trend line has a color, and every filter works. The meeting ends. Yet nobody has agreed what should happen next. This is one of the quiet contradictions of modern management. Access to data has become dramatically easier, but the distance between observing a number and accepting responsibility for a decision remains substantial. A dashboard can show declining sales; on its own it cannot establish the cause, compare the consequences of several responses, or determine who is authorized to act. When those questions remain open, a beautiful interface may simply organize organizational anxiety. I am less interested in how much information a company can display than in whether the information changes a decision responsibly.
Dashboards are useful—and have been asked to do the wrong job
Rejecting dashboards would be another technology overreaction. They remain valuable for monitoring, detecting anomalies and creating a shared view of performance. Microsoft's Power BI documentation describes their role in bringing important metrics together and linking visualizations to underlying reports and semantic models. The problem starts when leaders mistake the display of state for the management of choice. Falling net revenue is an observation, not a prescription. A company might change pricing, experiment with onboarding, adjust its product mix or deliberately wait. These choices carry different assumptions, costs and risks. Software designed to display measurements is not automatically designed to evaluate alternatives. The future of BI should therefore not be described merely as prettier dashboards with AI-generated summaries. The more serious question is which recurring business decisions can be made measurably better.
Start with the decision, not the visualization
When designing decision support, I would begin with four questions: what choice must be made, who owns it, how soon is it needed, and what would a wrong answer cost? Consider an increase in subscription cancellations. A product leader may be deciding whether to redesign renewal. Finance may be forecasting the effect on cash flow. Support may want to change its outreach. All three can look at the same chart while facing three distinct decisions. Defining the decision first lets us identify the minimum evidence, the missing information and the circumstances in which human escalation is mandatory. An experiment with notification timing is not equivalent to freezing a customer's account. One is easy to reverse; the other can have significant consequences. A useful system must represent that distinction as an operating rule, not leave it implicit in a meeting.
A number without shared meaning is a dangerous foundation
Before adding AI, organizations should ask whether their data means the same thing across departments. Is an active customer someone who logged in, purchased, holds a valid subscription, or received a service within a specified period? Does revenue mean orders booked, payments collected, or recognized revenue net of refunds and taxes? When sales and finance disagree on definitions, a language model can repeat the disagreement in fluent prose without resolving it. Microsoft Fabric defines semantic models as logical representations of analytical domains containing measures and business-friendly terms. The dbt Semantic Layer likewise aims to centralize metrics so downstream tools use consistent definitions. I see this layer less as an optional BI feature and more as an operational agreement about the meaning of numbers. Faster answers built on contradictory definitions are not necessarily better answers.
AI can accelerate analysis; it does not establish causality
Ask an AI assistant why sales fell over the past three weeks and it may compare segments, produce charts and present a persuasive explanation. Yet a correlation between declining orders and a price change does not prove the price change caused the decline. Inventory shortages, customer composition, seasonal effects or competing events may also matter. A trustworthy analytical system should separate observations, candidate explanations and tested causal claims. Consequential interventions may require controlled experiments, comparative designs or domain review. The fluidity of generated prose is not a substitute for evidence. A good assistant is capable of saying which assumptions are unverified and which additional observations could change its conclusion. The duty of decision-support technology is not to manufacture certainty on demand; it is to make the basis and limits of a recommendation visible.
Make the path from evidence to action traceable
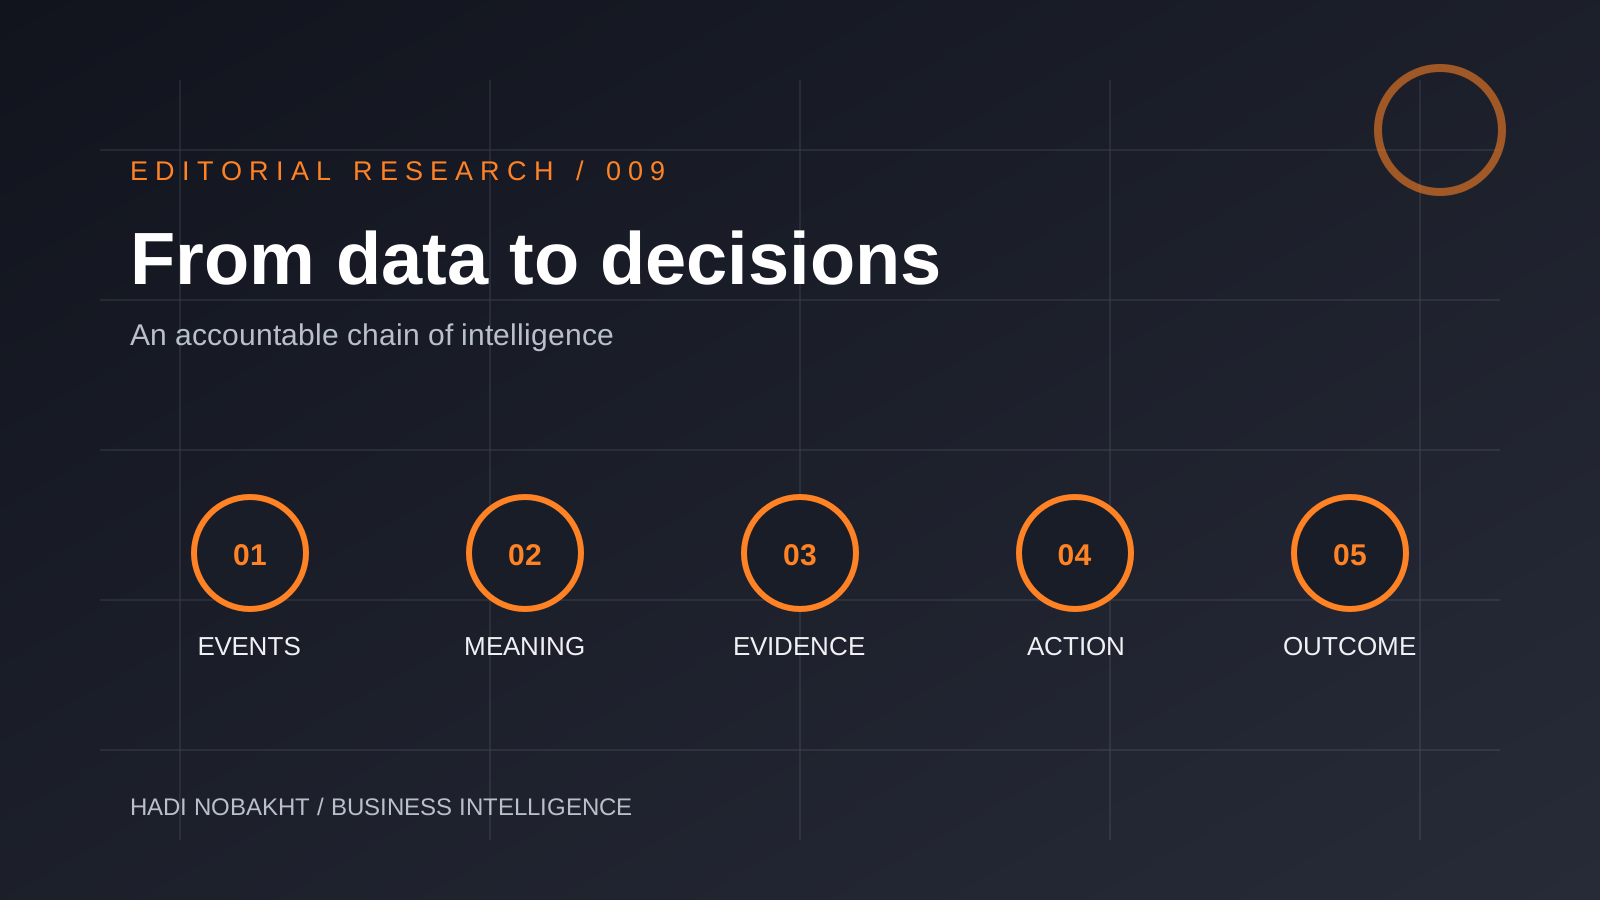
A practical architecture has six connected stages: event and data capture, governed metric definitions, detection of meaningful change, evaluation of hypotheses, proposed action and measured outcome. Each stage needs a timestamp, owner, source and known limitations. If refunds rise, the system should expose the time window, whether the metric changed definition, which groups contributed to the shift and what assumptions support a proposed response. It should then record who approved an action, what was actually executed and what happened afterward. This is more than automated reporting; it is institutional memory for decisions. Such memory makes learning possible, but it also needs access controls, retention rules and a secure audit trail. Without them, the same traceability that helps managers learn can become a source of privacy and operational risk.
Three classes of decisions need three levels of autonomy
Not every choice deserves the same degree of automation. The first group consists of low-risk, reversible actions such as selecting a time to display a reminder; bounded automation can often work well here. The second includes consequential but controllable choices such as changing an advertising budget; approval limits and spending ceilings become important. The third covers choices that materially affect rights, access or money: blocking a payment, restricting an account or changing a customer's credit exposure. These decisions call for stronger evidence, contestability, traceability and appropriate human oversight. The NIST AI Risk Management Framework emphasizes governance and risk assessment in the context in which a system is used. A capable model does not become a trustworthy system simply by being placed behind an attractive interface.
Count improved decisions, not additional charts
The number of dashboards produced is a weak measure of analytical value. So is the number of natural-language questions answered by a model. More useful measures include time from evidence to justified action, the rate at which weak recommendations are rejected, the cost of wrong decisions, the percentage of actions with traceable sources and the extent to which outcomes are reviewed afterward. Can the organization reconstruct which version of a metric or model informed a recommendation? Has decision quality improved compared with the previous process, or has activity merely accelerated? Sometimes a slower decision in a high-stakes setting signals maturity, not inefficiency. The promise of next-generation intelligence should be tested against outcomes, with a realistic baseline and an explicit accounting of failure costs.
The difficult part is organizational, not just technical
AI makes it tempting to purchase another platform and call the problem solved. But if nobody owns critical definitions, teams disagree about objectives and decisions are undocumented, another agent can simply accelerate the disorder. Gartner's June 2026 data-and-analytics trends highlight decision governance, including explainability and auditability of automated choices. That is an industry direction, not a promise that buying a category of software will make every business perform better. Start with one recurring process—refunds, customer retention or inventory replenishment. Map the choice, align the key terms, agree on authority and risk tolerance, then measure whether the proposed system improves outcomes. Technology should implement that agreement, not pretend to create it.
A working example: refund signals to defensible action
Imagine the refund rate in a digital service moving above its normal range. A dashboard triggers attention. A semantic layer clarifies whether the numerator represents refund requests or completed returns and whether failed payments belong in the denominator. An analyst then studies the change by product version, payment method and customer cohort. An AI assistant proposes several candidate explanations, perhaps an altered checkout screen or fulfillment delays, without calling them proven causes. Operations chooses a limited, reversible intervention and establishes a comparison baseline. The system measures refunds and unintended consequences after execution. All steps connect to a decision identifier and a lineage trail. It may turn out that the original hypothesis was wrong. Discovering that error promptly, rather than defending the first plausible story, is exactly what a learning decision system should enable.
Why the dashboard still belongs in the future
I do not expect dashboards to disappear. Leaders need situational awareness, specialists need interactive exploration, and teams need a common picture of performance. The point is that visualization should no longer be mistaken for the final step. In a more complete architecture, dashboards are one window onto a broader chain of semantics, analysis, evaluation, policy and feedback. Some decisions are too infrequent, political or context-dependent to formalize safely. In those cases a system can still create value by organizing the evidence and disagreements while leaving judgment with accountable people. The most mature technology understands the limits of its own automation.
From knowing more to deciding better
The next chapter of business intelligence is not about removing reporting or replacing every manager with AI. It is about transforming fragmented information into defensible judgment. The question changes from “What happened?” to “What options do we have, on what evidence, under whose authority and with what way to learn from the result?” No single product creates that transformation. It takes shared business definitions, sound architecture, institutional learning and clear decision rights. Given the choice between one more polished dashboard and resolving responsibility for a consequential decision, I would often choose the latter. An organization that can explain why it acted and evaluate what followed can become more intelligent even with simpler tools.